Wave pattern trading
Wave pattern trading is based around the Elliott Wave principle. Elliott discovered underlying social principles and developed a tool around this in the 1930’s. He proposed that markets will follow certain patterns. Many traders still use Elliot waves to this day in combination with the fibonacci sequence. Elliot did not actually know his wave patterns were following the fibonacci sequence quite closely. Here is an overview of the most commonly used Elliot waves and their characteristics.
Let’s look at an example:
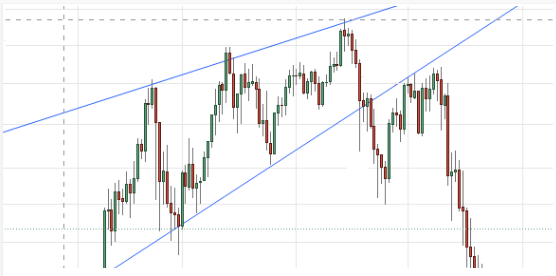
Source: TradingView, bitcoin daily chart
Once you see a pattern in the candle sticks, you can draw lines between certain price points. Most of the time these price points are based on the lowest lows and highest highs. As you can see in the example above, the next top is always a bit higher than the top before. And the lowests lows are always a bit higher than the lows before. If you draw two lines between those points, you can make and trade a wave. Now the tricky part is drawing the lines correctly.
Once the candle stick breaks out of the pattern (either up or down) it could mean there is a good trading opportunity. Once it breaks out the top wave line, it could mean bitcoin broke out the pattern and will move up. Once it breaks the lower blue line, it could mean bitcoin will go down. You’ll never know in advance if it will break through the wave moving up or break through down below or just going sideways. But there are some statistical chances of certain patterns having a particular outcome. For example, the statistical chance of an ending diagonal wave moving down after the 5th touch point is higher than the chance of breaking out on top. A theoretical example:
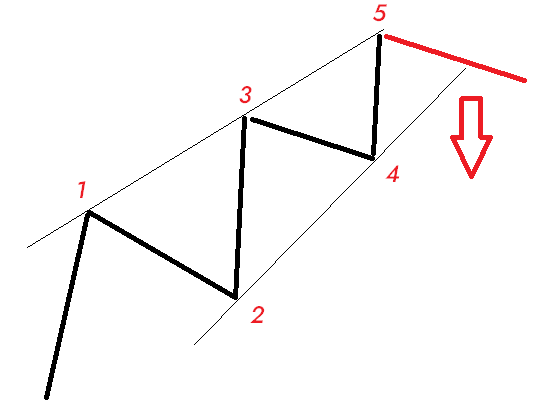
You can only use this wave if there are five clear touchpoints and you should only trade based on the fifth touch point. See more examples here: Elliot Wave Patterns overview
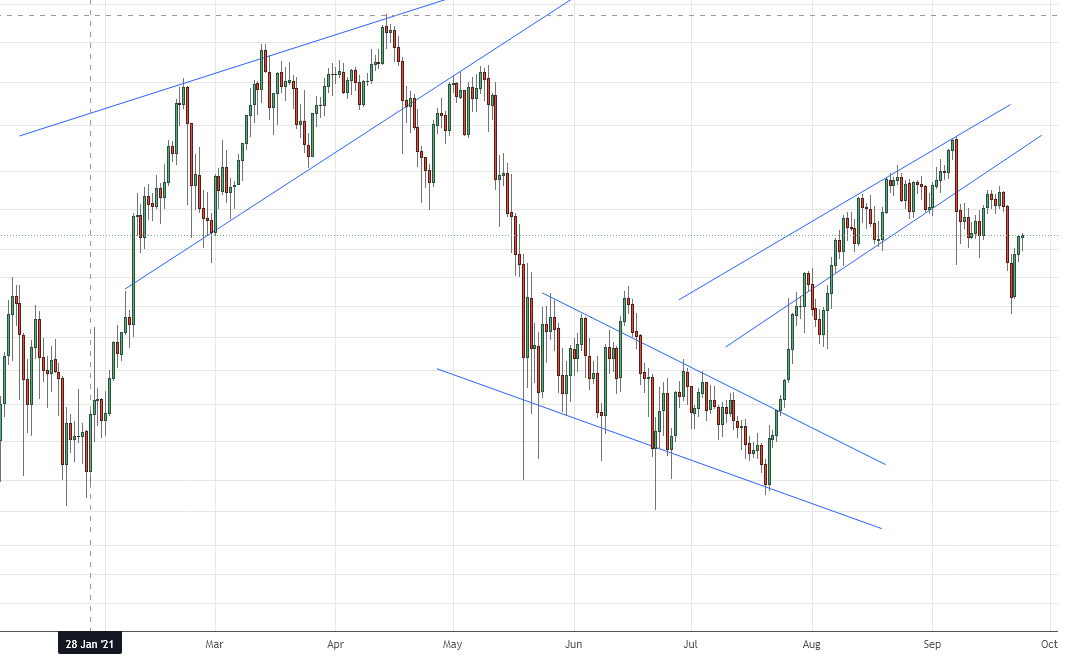
Bitcoin chart 2021
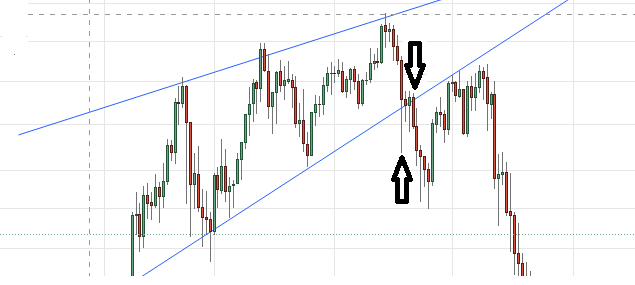
Here are some examples of wave patterns. The first one is a classic ending diagonal. As you can see, after the fifth touchpoint price broke the uptrend and price fell below the wave. Also note it actually did this two times. When we zoom in a little bit:
You can see the first wick of the candle breaking the wave and shooting back up again. A few days later, the price broke the wave again. It almost came back but after a short retest for a few days, a clear downtrend began. This was caused by news about Tesla selling Bitcoin. In this case, if traders are using wave patterns to trade they will know that the fifth touchpoint is important. Because, statistically there is a bigger chance that the price will drop.
If you know the chances of breaking the pattern in a downtrend means you have an opportunity to go short. Taking a short position means that you are expecting that the price will drop. When you go short, you lend the asset from someone else (the lender). If you are correct and prices drop you will buy the asset for the lower price and return the borrowed assets to the lender. The difference in price is your profit. For example:
- Bitcoin is $10.000 and you decide to go short
- You "borrow" 1 BTC from your broker and your broker directly sells it for the current market price (in this case $10.000)*
- You have the obligation to pay the broker back 1 BTC (note, this does not mean you owe $10.000).
- Bitcoin drops to $8500 and you decide to sell your position
- You can now buy 1 BTC back for $8500 and return it to the broker
- $10.000 - $8500 = $1500 in profit (minus fees)
* You don't always borrow from your broker. On some platforms you actually borrow from other random people.
But if you are wrong and the price goes above $10.000 it will cost you money. That is where stop losses come into play. With stop losses you can stop your losses by pulling on the break and selling your position before hell breaks loose. Almost every professional trader uses stop losses. Without the proper use of stop losses your risk vs reward ratio is doomed.
Let's have a look at the above example and how you could setup this trade:
- You already know that there is a statistically higher change that the trend will break the wave on the down side. Based on the Elliott Wave principle
- Because the trend is expected downwards, you know you have to go short
- Now you have to determine when you are wrong and set your stop loss at that exact point
The last point is important. When you know the price might go down below the wave, you have to set your stop loss above the blue line. Because if the trend does not break the wave, a downtrend will most likely not happen yet and your prediction of the price breaking the wave is false. So basically you have to ask yourself:
“At what point do I think that I'm wrong? At what price point do I almost certainly know that it will not follow my prediction?"
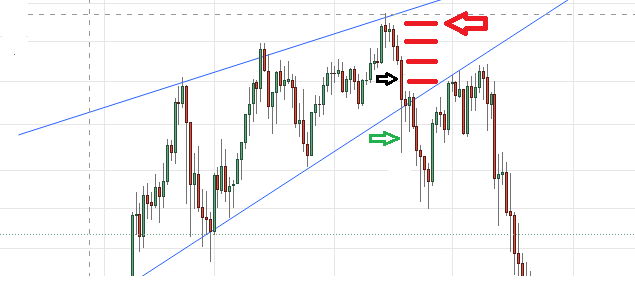
You know you are certainly wrong when the price bounces off the wave line and goes all the way up to the point of the red arrow. Because the principle behind this particular Elliot Wave states that the price will drop below the wave.So you have to narrow it down a bit. Are you wrong when the price bounces up to the third red line? Probably. Are you wrong when the price bounces back up to the second red line? Maybe. Are you wrong when the price bounces back to the first red line? It’s a delicate task to put your stop loss at the right position.
You could place your stop loss around here (red line):
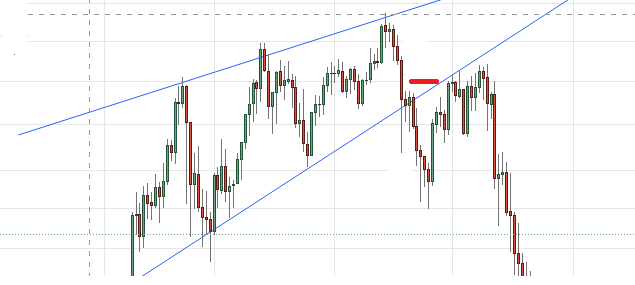
But keep in mind everyone determines their stop loss on their own terms. Meaning there is no specific point where you should put your stop loss. You could set your stop loss near the blue line but then you risk being hunted. Stop loss hunting means that many traders know other traders are using wave patterns or other general techniques to trade. Meaning they also know where most people put their stop loss. If they can push the price far enough they can trigger many stop losses while the price will fall back shortly after. In that case you lost your position.
You can also set the stop loss much higher. But then you risk losing more if you are wrong. Besides, placing the stop loss is also based on the wave pattern you have drawn (the two blue lines). If you draw the lines wrong, you are trading on wrong information which might cost you money. Trading wave patterns requires you to:
- Draw the wave correctly (and determine if there even is a wave pattern going on)
- Know what statistical chance will happen based on the wave pattern
- Going short or long at the right position
- Putting the stop loss at the right position
- Determine the right exit strategy (when to take profit)
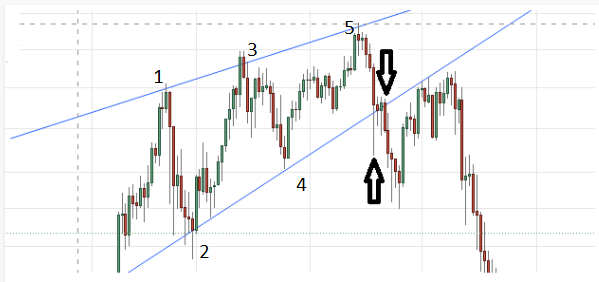
Although it seems quite easy to do, it’s actually pretty hard to get it right every single time. If you look closer to the above example you might notice that there probably was some stop loss hunting going on. Let’s take a closer look:
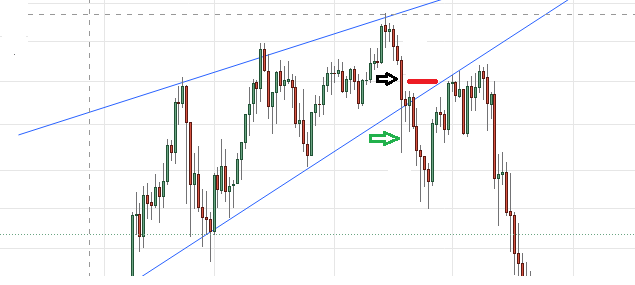
You determined your entry point (green arrow). You also determined your stop loss (red line). Eventually the price went below your entry point so you are now in a short position. But the price went back up again all the way up to the black arrow. Because the black arrow is above the red line your stop loss triggered and you have sold your position at a loss. Only a few days later the price drops again but now drops further down. This is where you could make some profit. In the first attempt, a possible stop loss hunting took place. Simply because every trader out there is looking at the same patterns and the same charts.
The psychology behind this is pretty simple. Many traders know other traders will buy in when the price drops below this point because this is the point where the wave breaks and people expect the price to drop. But if bigger players start to buy again at this point, the price won’t drop while many traders take a short position. If the price goes back up again and it goes high enough, many stop losses will be triggered. Because the only logical place to have a stop loss is somewhere above the wave line.
Using leverage
Many traders also use leverage. This means they borrow bitcoin (or other assets) to get more buying power. The most important thing to understand is that when you use leverage, the amount of leverage will determine your maximum stop loss. You can’t use 100x leverage and place your stop loss anywhere you want. That has everything to do with the liquidation price.
When you use leverage you are borrowing money. The borrower won’t give or risk that money for free. They actually risk zero because before your trade goes beyond the amount of money you can pay back your position will be liquidated. You’ll receive a margin call saying that your account balance is too low to stay in the trade. Your position gets liquidated or you need to bring more money to your account.
The higher amount of leverage you use, the closer the liquidation price (relative to your entry price) will be.
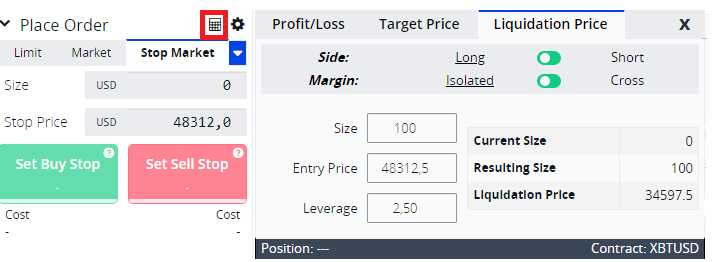
Source: bitmex
In this example we use 2.5x leverage. You can see your entry price is $48,312 and the liquidation price is $34,597. If you ramp up leverage to 100:
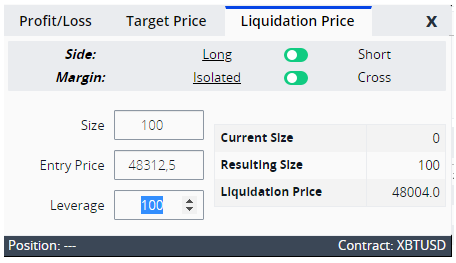
The entry price is exactly the same only your liquidation price is $48,004 instead of $34,597. In other words, your stop loss can only be placed between $48,312 and $48,004. Once you hit the liquidation price it’s game over.
And to make things even more confusing, using leverage in forex works in another way than bitmex for example. When you use leverage in forex, you only set the maximum amount of leverage once in your account and never touch it again. While trading on bitmex requires you to manually set the amount of leverage and the kind of margin you want to trade. You can also trade one pair at the time.
Everything combined makes trading a hard skill to learn. It’s not only about drawing waves or some lines on the chart. You also need to determine your position size, the amount of leverage (if any), your take profit price and your stop loss position. If you ramp up leverage you have no headroom for mistakes.
It's up to you to draw the wave correctly and interpret the actual wave. You can only do this with practice. Just go back a few years, draw some lines when you notice a pattern and see what will happen. You also have to play around with placing stop losses and determining your entry points. There is no perfect entry or exit point because every asset behaves differently.
[keypoint text= Key concepts
- Wave patterns are based on Elliot Waves which have some statistical benefits (although many people doubt this)
- If you want to apply these waves to your trading strategy take a look at the following chart: Elliot Wave Patterns overview
- When you go short you borrow assets from someone else (your broker). You have the obligation to pay the lender back in full.
- Stop losses are used to prevent losing too much money when you are wrong about your analysis. But be aware that a normal stop loss does not provide 100% protection against losses.
- The higher amount of leverage you use, the less headroom you have for a move in the opposite direction]
Good job! You gained 5 XP and 0 0 5 . What's next:
- Share my article with someone you think should learn this too:
- Let me know what you think in the comments.
- Want to learn more? Click on the next article below. You gain another 5 XP and 0 0 5 .
- Join the community if you want to keep your earnings and track your progress: Join the community

Read more articles
- 1. How to buy stocks that Warren Buffett buys, but at a Discount!2. The economic machine - what cycle are we in right now?3. Don't remain a slave of the government4. The one thing you need to make a living of day trading that nobody tells you5. Going short and long in trading6. Are you ready for live day trading?7. Wave pattern trading8. Eight rules to mentally prepare you for trading and investing9. The eight wonder of the world: compound interest10. Going short and long in trading
Comments
How you think about this?