Price to Book Ratio
The book value of is what remains when you subtract total liabilities from total assets. This can also become negative which means has more debts than assets.
The price to book ratio shows the investor if the stock is under or overvalued. A high price to book ratio means that the investor is paying more for a share than has in total assets.
How to use PB ratio

A PB ratio of 3 means the investor is paying $3 for each $1 in book value.
- Lower is better.
- At or below 1 is considered healthy.
- Can be very different between industries.
- Can be used to compare companies.
Why do investors use PB ratio in their analysis
Helps investors to determine if the current stock price is under or overvalued. A low PB ratio means the company’s stock is trading for less than the leftover of total assets - total liabilities. PB ratios can also turn negative which means the company might be in serious financial trouble. In other words, the company has more liabilities than assets.
The three steps every investor should look at:
- What is the current PB Ratio?
- How does it compare to the industry?
- What is the trend?
Things to be aware of
- Only compare with other companies in the same industry.
- Negative PB ratio means that the company might be in serious financial trouble.
- A higher PB ratio than 1 also means that you are last in line (shareholders get paid last when a company defaults) when the company goes bankrupt for whatever reason.
How to calculate price to book ratio
- Calculate the book value: total assets - total liabilities.
- Calculate book value per share: book value / total outstanding shares.
- Price to book ratio = share price / book value per share.
A real life example of Tesla. You need the following data to determine Price to book ratio:
1. Calculate the book value: total assets - total liabilities:
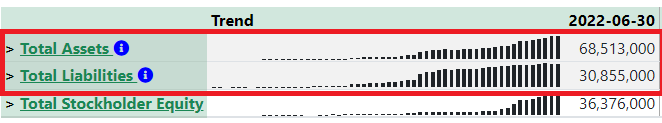
- Book value = $68,513,000 - $30,855,000 = $37,658,000
2. Calculate book value per share:
- Book value per share = $37,658,000 / total outstanding shares (can be found in the latest balance sheet):
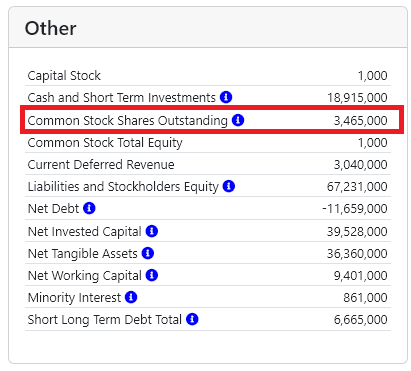
- Book value per share = $37,658,000 / 3,465,000 = $10.868
3. Price to book ratio = share price / $10.868:

- MRQ (most recent quarter) PB ratio = $673.420 / $10.868 = $61,96
Investors are paying $61,96 for each $1 in book value. This is considered very overvalued.
The price to book ratio is another way to determine if a stock is under or overvalued. The PB ratio is used to compare the current stock price to its book value. In other words, the PB ratio is used to compare all the assets minus liabilities in relation to the stock price.
If the PB ratio is greater than 1 that means the stock is trading for a higher price than the intrinsic value of the company. Meaning, you pay more than what the company is worth. Although future growth is hard to measure. A higher PB ratio than 1 also means that you are last in line (shareholders get paid last when a company defaults) when the company goes bankrupt for whatever reason.
Book value is limited for companies that offer services because there are not many tangible assets on the balance sheet compared to large manufacturing companies. It also does not take brand names, patents and other things in consideration.
Good job! You gained 5 XP and 0 0 5 . What's next:
- Share my article with someone you think should learn this too:
- Let me know what you think in the comments.
- Want to learn more? Click on the next article below. You gain another 5 XP and 0 0 5 .
- Join the community if you want to keep your earnings and track your progress: Join the community
Comments
How you think about this?