Reasons to invest in ETFs
There are various reasons to invest in ETFs over mutual funds. There are also various reasons to pick a passively managed fund over an active managed fund. ETFs gained huge popularity from investors in the last decade. This is not without reason.
If you are familiar with investing you probably have heard about Warren Buffet. Warren is one of the most successful (or the most successful) investors of all time. Together with Charlie Munger he owns and runs Berkshire Hataway. The biggest investment company that exists today (2021) by a very large margin. Once a year, Warren releases his annual letter to shareholders. In these letters he provides tips and insights about how he looks at the markets. These letters provide extremely valuable information you can use to your advantage. You can find the letters on the website from Berkshire hathaway.
In the 2016 letter to shareholders (page 20 on top), Warren recommends that most traders are best off with an ETF. Actually, Warren Buffet dared the smartest people in the investing industry betting 1 million dollars that a passive investment (like an low cost S&P 500 ETF) would outperform any handpicked stock portfolio managed by Hedge Funds over a 10 year period. Ted Seides, CEO of a very big Hedge Fund, accepted the challenge. At the end of the bet, ending in 2017, Warren Buffet’s ETF gained 7.1% annually and the handpicked portfolio of Ted only gained 2.2%. Even if the investor did not have to pay any maintenance fees, the hedge fund would still perform less.
Below an overview of active managed funds vs ETFs that only track an index:
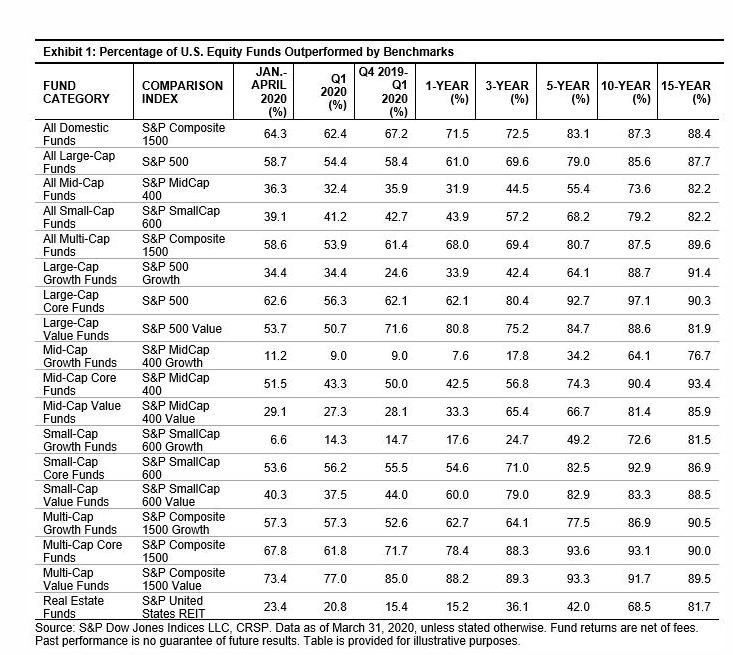
In the first row you can see the actively managed funds vs the second row which are index markets. Meaning the managers in the first row handpicked their own stocks while the second row just follows the index. The last row represents how much % of the actively managed funds were outperformed by standard index funds over a 15 year time period. A staggering 90%+ of actively managed funds did not outperform the standard index funds. They performed on par or much worse. Even if they perform on par, the higher fees that are associated with actively managed funds destroys the gains.
If 90% of professional companies that are investing over many decades can’t even beat the index in the long term, what are the chances you will beat the index? Don’t get fooled too easily. Large investment companies do not have the position to buy and sell stocks a retail investor can. Many stocks are out of their reach while private investors have many more options they can choose from. The only thing is, how much time do you want to invest to find these stocks? It’s perfectly possible to beat the market index, but it may take years of learning to make that happen. Besides, buying an index ETF is by far the easiest thing to do. You only have to buy one and hold it forever. That’s the reason why ETFs are so popular. That does not mean you should blindly buy shares from an ETF. You should first determine your long or short term strategy and decide if ETFs or other funds fit into this strategy. You can also choose to deep dive into the details and pick your own stocks. This might be the most difficult thing you can do but it also might give you the highest rewards. It also helps you to make better decisions in the future.
My trading tools can help you with that. You can easily compare tens of thousands of stocks, compare trends and ratios and even do technical analysis. You can also check every income statement and balance sheet from every company. I explained every detail so even a beginner can use my tools with ease.
Key Concepts:
- Warren Buffet recommends ETFs to any individual investor due to low cost and low maintenance.
- Over a period of 15 years, only 10% of all mutual funds and other funds outperform the index.
- ETFs give average returns at best.
- You can use my trading tools to find companies and build a portfolio that might outperform ETFs.
Good job! You gained 5 XP and 0 0 5 . What's next:
- Share my article with someone you think should learn this too:
- Let me know what you think in the comments.
- Want to learn more? Click on the next article below. You gain another 5 XP and 0 0 5 .
- Join the community if you want to keep your earnings and track your progress: Join the community

Chapters: The Ultimate Investing Guide
- 1. Intro2. What is investing?3. What are stocks?4. Types of stocks5. Why buy stocks?6. How to buy stocks7. Store stocks8. Stock splits9. Stock quests10. What are bonds?11. Secured bonds and maturity12. How do bonds work?13. Credit rating14. Treasury bonds15. Corporate bonds16. Municipal bonds17. Agency bonds18. Bond quests19. Mutual funds20. Mutual funds earnings21. ETFs22. Why ETFs23. Index funds24. Hedge funds25. Derivatives26. Commodities27. Indices28. Overview29. Determine company value30. IPOs31. Penny stocks32. Dividends33. Financial health34. Profitability35. Operating efficiency36. Liquidity37. Solvency38. Market Evaluation39. Not only numbers40. Investing portfolio considerations41. Creating portfolio42. Buy/Sell Strategy43. Broker44. Emotions45. Final steps46. Key Concepts
Comments
How you think about this?