What are hedge funds?
Hedge funds are companies that use advanced trading techniques. They have a wide range of trading and investing activities. Hedge funds are typically open-ended funds. These wide range of trading and investing techniques include:
- Long and shorting
- Using leverage
- Arbitrage
- Using derivatives
- And many more
Other characteristics of hedge funds are:
- Only open to wealthy people or institutions/corporations (think pension funds)
- Not very transparent
- Can hold any asset
- High fees
- Sometimes restriction on cashing out
The structure of a hedge fund is based on a partnership between the fund manager and it’s investors. The hedge fund manager typically invests a large portion of its own capital into the fund. There are a few important roles within the hedge fund:
24.1 Auditors
Auditors verify financial statements determined by law.
24.2 Prime broker and executing broker
The prime broker facilitates large active trading activities. They act as the central entity that can perform all the wanted trading activities for the hedge fund. An execution broker is the broker that processes the buy and sell orders from investors. While there can be multiple execution brokers, all trades are cleared through the prime broker. This simplifies operations for the hedge fund.
24.3 Hedge fund manager
Determines the strategy, asset allocation and the amount of risk. The manager also has personal capital in the fund and is getting paid through maintenance fees. They typically also get performance fees if the fund is performing above a certain benchmark level. Hedge funds managers are regulated by the SEC.
While there is much more to tell about hedge funds, that goes beyond this guide. Main reason is that very few people can invest in hedge funds because you need a very high amount of capital. You need at least $200.000 in annual earnings and need a net worth of at least $1.000.000 without counting your house.
But we can have a quick look at the average performance:
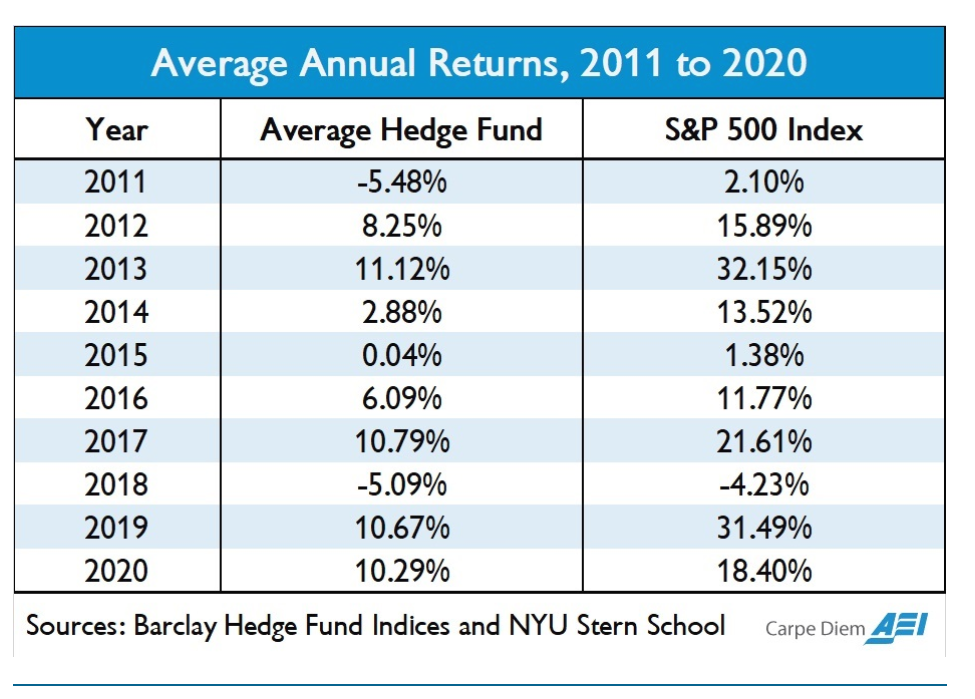
What this picture tells you is that highly professional hedge fund managers using various advanced trading techniques can’t outperform the S&P 500.. Not only do index funds outperform hedge funds, they do so with very large margins. Just like the bet Warren and Ted Seid made I talked about a few chapters back. That does not mean hedge funds have no role in the investing space. But comparing the results to simple index trackers shows the real power of zero effort investment strategies.
Key Concepts:
- Hedge funds use various investing and trading tactics including arbitrage and leverage.
- Hedge funds can only be used when you have a very high net worth / income ($1 million net worth without counting your house).
- Not very transparent
- Can hold any asset
- High fees
- Sometimes have restrictions on cashing out.
- Hedge funds managers are regulated by the SEC.
- Hedge funds perform worse compared to indices (indexes).
Good job! You gained 5 XP and 0 0 5 . What's next:
- Share my article with someone you think should learn this too:
- Let me know what you think in the comments.
- Want to learn more? Click on the next article below. You gain another 5 XP and 0 0 5 .
- Join the community if you want to keep your earnings and track your progress: Join the community

Chapters: The Ultimate Investing Guide
- 1. Intro2. What is investing?3. What are stocks?4. Types of stocks5. Why buy stocks?6. How to buy stocks7. Store stocks8. Stock splits9. Stock quests10. What are bonds?11. Secured bonds and maturity12. How do bonds work?13. Credit rating14. Treasury bonds15. Corporate bonds16. Municipal bonds17. Agency bonds18. Bond quests19. Mutual funds20. Mutual funds earnings21. ETFs22. Why ETFs23. Index funds24. Hedge funds25. Derivatives26. Commodities27. Indices28. Overview29. Determine company value30. IPOs31. Penny stocks32. Dividends33. Financial health34. Profitability35. Operating efficiency36. Liquidity37. Solvency38. Market Evaluation39. Not only numbers40. Investing portfolio considerations41. Creating portfolio42. Buy/Sell Strategy43. Broker44. Emotions45. Final steps46. Key Concepts
Comments
How you think about this?